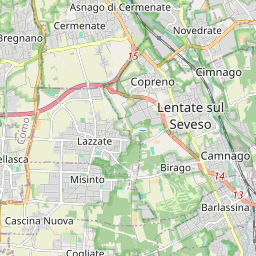
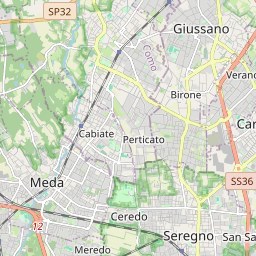
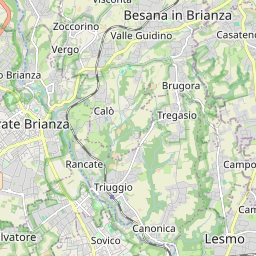
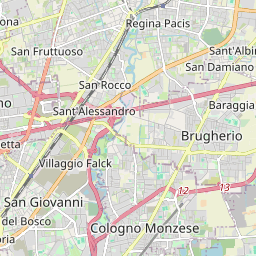
Lissone: 46,792 inhabitants (2026)
ISTAT Code: 108028
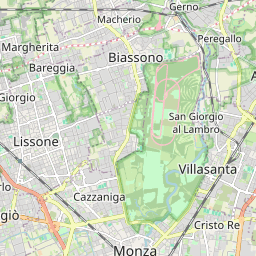
45.6105°N, 9.2439°E
Explore related data
Jump from local statistics to linked rankings and territorial pages.
Region page
Open the full profile page for Lombardia.
Province page
Open the full profile page for the province of Monza e della Brianza.
Income overview
Explore the income map and the municipalities with the highest and lowest values.
Regional income ranking
View the municipalities in Lombardia ranked by average income.
Provincial population ranking
View the municipalities in the province of Monza e della Brianza ranked by population.
Compare this municipality
Open the comparison page with this municipality preselected.
Population & demographics
All demographic data for Lissone: population, births, deaths, balances and historical trends.
Income & tax data
Average income, median income, income brackets and historical trends for Lissone.
Environment & air quality
Air quality (PM2.5, PM10, NO2) and land consumption data for Lissone.
Lissone is a medium-sized municipality in the province of Monza e della Brianza, Lombardia region. With a population of 46,792 inhabitants and a density of 5,031 per km², it covers an area of 9.3 km². The average declared income is €29,639.
Lissone in numbers: the analysis
The generational balance is in line with the norm: the ageing index of Lissone is 168 (over-65s per 100 under-14s).
Looking ahead to 2050, projections give Lissone about 50,975 inhabitants, up 8.9% from today.
The average municipality in the province of Monza e della Brianza has about 16,062 residents: Lissone has 2.9 times as many.
Lissone is among Italy's major centres: the country's no. 162 municipality by population out of 7896.
Few municipalities in Lombardia are larger: it ranks no. 20 by population out of 1502.
By population, Lissone ranks no. 2 among the 55 municipalities of the province of Monza e della Brianza.
Lissone has grown substantially since 1951: from 18,931 inhabitants then to 46,792 in 2026, an increase of 147.2%.
Population Trend
Male/Female Ratio
Demographic Statistics
Demographic Indices
Denominator: annual mean population
Denominator: annual mean population
Births (recent years)
Historical Population (1951-present)
Marital Status (2025)
School-Age Population (2026)
Total 0-18 years: 7,968
Foreign residents
Foreign presence and top citizenships
Denominator: residents on 1 January (stock)
Embed this chart
Use the Lissone population pyramid on your site or article — the DatiItalia source link is already included.
<a href="https://datitalia.eu/comune/lissone-108028" title="Population pyramid of Lissone — DatiItalia"><img src="https://datitalia.eu/render/chart/piramide/lissone-108028" alt="Population pyramid of Lissone — DatiItalia" width="600" style="max-width:100%;height:auto;border:0" loading="lazy" /></a>