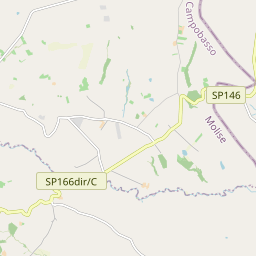
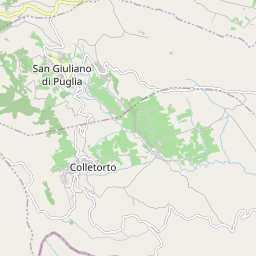
Santa Croce di Magliano: 3.820 inhabitants (2026)
ISTAT Code: 070072
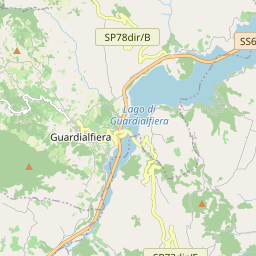
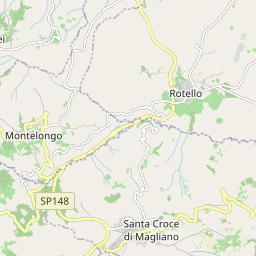
41.7125°N, 14.9911°E
Explore related data
Jump from local statistics to linked rankings and territorial pages.
Region page
Open the full profile page for Molise.
Province page
Open the full profile page for the province of Campobasso.
Income overview
Explore the income map and the municipalities with the highest and lowest values.
Regional income ranking
View the municipalities in Molise ranked by average income.
Provincial population ranking
View the municipalities in the province of Campobasso ranked by population.
Compare this municipality
Open the comparison page with this municipality preselected.
Population & demographics
All demographic data for Santa Croce di Magliano: population, births, deaths, balances and historical trends.
Income & tax data
Average income, median income, income brackets and historical trends for Santa Croce di Magliano.
Environment & air quality
Air quality (PM2.5, PM10, NO2) and land consumption data for Santa Croce di Magliano.
Santa Croce di Magliano is a small municipality in the province of Campobasso, Molise region. With a population of 3.820 inhabitants and a density of 72 per km², it covers an area of 53,4 km². The average declared income is 16.630 €.
Santa Croce di Magliano in numbers: the analysis
The census record tells a story of long decline: in 1951 Santa Croce di Magliano had 6,111 inhabitants; today (2026) it has 3,820 — 37.5% fewer.
The ageing index is one of the starkest signals: in Santa Croce di Magliano there are 318 residents over 65 for every 100 under 14, well above the national average.
Demographic projections to 2050 estimate about 2,542 inhabitants for Santa Croce di Magliano: an expected decline of 33.5% from today.
The average municipality in the province of Campobasso has about 2,473 residents: Santa Croce di Magliano has 1.5 times as many.
Few municipalities in Molise are larger: it ranks no. 14 by population out of 136.
Among the 84 municipalities of the province of Campobasso, Santa Croce di Magliano ranks 11 by population.
Population Trend
Male/Female Ratio
Demographic Statistics
Demographic Indices
Denominator: annual mean population
Denominator: annual mean population
Births (recent years)
Historical Population (1951-present)
Marital Status (2025)
School-Age Population (2026)
Total 0-18 years: 474
Foreign residents
Foreign presence and top citizenships
Denominator: residents on 1 January (stock)
Embed this chart
Use the Santa Croce di Magliano population pyramid on your site or article — the DatiItalia source link is already included.
<a href="https://datitalia.eu/comune/santa-croce-di-magliano-070072" title="Population pyramid of Santa Croce di Magliano — DatiItalia"><img src="https://datitalia.eu/render/chart/piramide/santa-croce-di-magliano-070072" alt="Population pyramid of Santa Croce di Magliano — DatiItalia" width="600" style="max-width:100%;height:auto;border:0" loading="lazy" /></a>