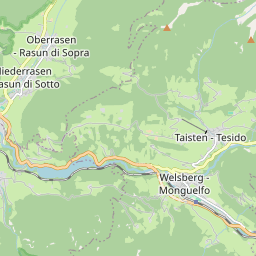
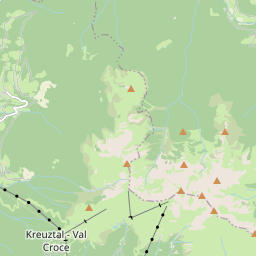
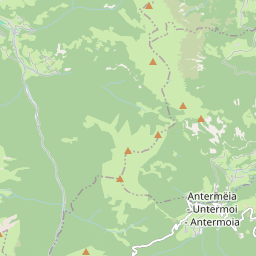
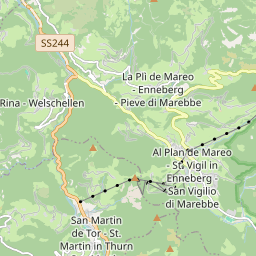
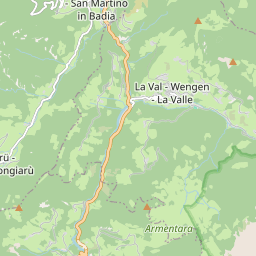
Marebbe: 3,221 inhabitants (2026)
ISTAT Code: 021047
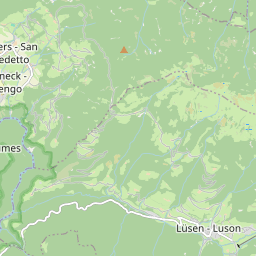
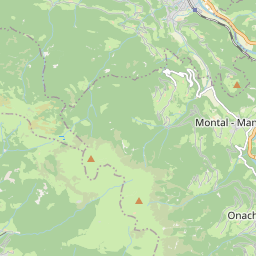
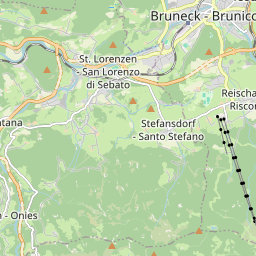
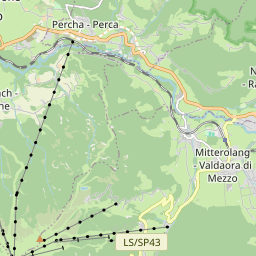
46.6975°N, 11.9327°E
Explore related data
Jump from local statistics to linked rankings and territorial pages.
Region page
Open the full profile page for Trentino-Alto Adige/Südtirol.
Province page
Open the full profile page for the province of Bolzano/Bozen.
Income overview
Explore the income map and the municipalities with the highest and lowest values.
Regional income ranking
View the municipalities in Trentino-Alto Adige/Südtirol ranked by average income.
Provincial population ranking
View the municipalities in the province of Bolzano/Bozen ranked by population.
Compare this municipality
Open the comparison page with this municipality preselected.
Population & demographics
All demographic data for Marebbe: population, births, deaths, balances and historical trends.
Income & tax data
Average income, median income, income brackets and historical trends for Marebbe.
Environment & air quality
Air quality (PM2.5, PM10, NO2) and land consumption data for Marebbe.
Marebbe is a small municipality in the province of Bolzano/Bozen, Trentino-Alto Adige/Südtirol region. With a population of 3,221 inhabitants and a density of 20 per km², it covers an area of 160.3 km². The average declared income is €31,455.
Marebbe in numbers: the analysis
Looking ahead to 2050, projections give Marebbe about 3,751 inhabitants, up 16.5% from today.
Among the 116 municipalities of the province of Bolzano/Bozen, Marebbe ranks 46 by population.
Marebbe has grown substantially since 1951: from 2,147 inhabitants then to 3,221 in 2026, an increase of 50%.
Marebbe is demographically young: the ageing index stops at 115 elderly residents per 100 children.
Population Trend
Male/Female Ratio
Demographic Statistics
Demographic Indices
Denominator: annual mean population
Denominator: annual mean population
Births (recent years)
Historical Population (1951-present)
Marital Status (2025)
School-Age Population (2026)
Total 0-18 years: 674
Foreign residents
Foreign presence and top citizenships
Denominator: residents on 1 January (stock)
Embed this chart
Use the Marebbe population pyramid on your site or article — the DatiItalia source link is already included.
<a href="https://datitalia.eu/comune/marebbe-021047" title="Population pyramid of Marebbe — DatiItalia"><img src="https://datitalia.eu/render/chart/piramide/marebbe-021047" alt="Population pyramid of Marebbe — DatiItalia" width="600" style="max-width:100%;height:auto;border:0" loading="lazy" /></a>Municipalities in the same province
Municipalities in the same region
Municipalities with similar population
Salorno sulla strada del vino
3.823 · Bolzano/Bozen, Trentino-Alto Adige/Südtirol
Fiè allo Sciliar
3.709 · Bolzano/Bozen, Trentino-Alto Adige/Südtirol
Tione di Trento
3.674 · Trento, Trentino-Alto Adige/Südtirol
San Leonardo in Passiria
3.642 · Bolzano/Bozen, Trentino-Alto Adige/Südtirol
San Giovanni di Fassa
3.622 · Trento, Trentino-Alto Adige/Südtirol
Badia
3.575 · Bolzano/Bozen, Trentino-Alto Adige/Südtirol